How to Read Stock Market Charts
Doug is an active trader of stocks, bonds, and commodities, as well as an experienced non-fiction writer.

Learn how to interpret the meaning of stats and symbols on stock market charts.
Looking at a simple stock chart like the one below, it is easy to get flustered if you have never taken the time to learn about the stock market or how these quotes work. But it only takes a few minutes to understand that all these numbers have fairly simple meanings. Here is an explanation for each of the lines on this stock quote.

Stock chart for AT&T
Explaining the Terms in the Stock Chart
In this section, we'll go over what each of the terms in the above chart means.
AT&T, Inc. (T)
This refers to the name of the company. In this case, it is the multinational communications company AT&T, which is based in Dallas, Texas. The (T) is the symbol used for this company on the Exchange.
NYSE
的New York Stock Exchange, or NYSE, is one of the largest financial markets and stock exchanges in the world. It is here that trading takes place every Monday to Friday, excluding bank holidays, from 9:30 AM to 4 PM EDT. This phrase may vary depending on where the stock is listed. For example, it could say “NasdaqGS,” which refers to the NASDAQ stock market. Companies that are traded on foreign stock exchanges will have their respective country’s stock exchange listed, such as the LSE or Taiwan.
(0.38) (0.97%)
的se numbers, along with the upward arrow before them, indicate how the stock is performing in comparison to the close of the previous day. In this photograph, the up arrow shows that the stock’s price ticked upwards. 0.38 refers to the increase in the stock’s price. The percentage refers to the percentage increase in the stock’s price, relative to the last recorded figure.
If you are looking at the stock’s price during regular stock hours, the time stamp next to it will indicate when the quote was taken. In this example, the time stamp says 4:00 PM EDT. This means that the stock closed the day’s trading at $0.38 higher than it did at the end of the previous day.
After Hours
When you look at the price and percentage increase or decrease after these words, they indicate how the stock is performing during “after hours” trading. There is always some trading going on after hours, which usually takes place between major banks or firms. In this example, the price of the stock is at 39.47 after hours. This marks a $0.02 increase from the close of the day, which is reflected in the numbers. The percentage increase is 0.05%, which is also written in the same line. The time at the very end of the line, 7:50 PM EDT, refers to the time when this quote was taken.
Prev. Close
This refers to the value that the stock had when it closed at the end of the previous day. In this example, the AT&T stock closed at 39.07 the previous day. This is confirmed when we see that today’s closing price is 39.45, or 0.38 higher than 39.07.
Open
Here is the price value at which the stock opened on the day in question. The "open" value is different from the "previous close" value because of the after-hours trading that we mentioned earlier. While the volume of after-hours trading is far lower than regular stock exchange hours, it still has a positive or negative impact on the stock’s price. However, this impact is rarely more than a few cents, unless a major event concerning the company or its industry took place the previous day, or after the stock market closed. For example, if a company files a significant earnings report near the end of the day on the stock exchange, it could lead to a greater volume of trades after hours.
BidandAsk
这两个值是指买卖。的"bid" is what people are willing to pay in order to buy the stock, while the "ask" refers to what people are willing to sell the stock for. Keep in mind, the bid price is thehighestprice you are seeing on the market, while the ask price is theloweston the market. This means that there are people bidding lower than the value indicated, while there are also people willing to sell the stock for a higher price than indicated on this chart. The x200 and x100 numbers listed next to the bid and ask values refer to the stock’s volume. In this example, it means that people are willing to buy the stock for as high as $39.46 at 200 shares or more. In the ask situation, it means that people are willing to sell 100 shares or more for as low as $39.48. This information is only useful if you are looking to actively trade the stock, not if you simply want to look at its day-to-day price fluctuations.
1Y Target Est.
这个数字的平均值代表什么utable analysts believe the stock will be at in a year from now. In this case, it means that the average opinion of analysts indicates that the AT&T stock will sit at 37.89 on the 5thof April 2017. If the price is lower than the current price, which is the case for AT&T, it means investors do not have a lot of confidence in the company or its stock. If you see a price lower than the current value, you might want to consider investing elsewhere. This number is typically higher for a majority of stocks, because investors are usually confident of a company’s year-to-year progression.
Beta
的Beta value is very interesting because it is a numerical way to measure the volatility of a stock. The volatility is measured relative to the index where it trades, not the market in general. In this case, we see that AT&T has a volatility, or beta value, of 0.278821 in comparison to the general New York Stock Exchange. This means it is 0.278821 times more volatile than the index over a certain period of time. If the beta value is less than one, it means the stock is actually LESS volatile than the index. If it is greater than one, it means it is more volatile than the index. A beta value of one indicates its volatility is perfectly in line with its index.
If you are looking to invest in companies for the first time, you should stick with companies that have a lower beta value. It is common for utility companies to have very low beta values, while technology companies have higher beta values. In addition, larger companies that have been around for many years will have lower beta values.
Next Earnings Date
Here is the date for the next time this company will publish their earnings report to the general stock market. In this case, it appears AT&T will next publish their earnings report on April 26th, 2016.
If you are not aware, you should know that the earnings report of a company is the single most important factor that determines their stock price. If the market has wind of a bad earnings report for a company, you will start to see their share price decline as more people sell. Companies with good earnings reports will see a rise in stock price, while companies with bad reports will see their stock price fall.
However, this is not a steady rule. If an entire industry is struggling, the earnings report is viewed slightly differently. For example, let’s say that the entire utilities industry is hypothetically struggling and many major companies have reported earnings reports with decreases of 20 or 30 percent from the last quarter. If AT&T comes out with an earnings report of just 5 or 6 percent below the last quarter, they might be viewed favorably by investors because they expected a much lower number. They will see AT&T as more stable and safe from industry trends than their competitors. They might also think that AT&T is more likely to see a solid bounce-back in the following quarters than other utility companies.
Day’s Range
这里我们有一天的股票价格的范围in question. It indicates the highest and lowest prices of the day, showing you how much the stock fluctuated in value through the day’s trading. In this case, we see that A&T went as low as 38.95 and as high as 39.60. The spread here is fairly small, which means that AT&T had a regular, unspectacular day of trading. It went higher when there were greater volume buys, and it went down when more selling took place. In the end it stabilized and closed at 39.45. If the spread is much larger, it means that the stock had a very volatile day. Perhaps investors expected some good news, but got really bad news instead. This resulted in a lot of buying followed by a sharp increase in selling.
52wk Range
As you would expect, this is the range of stock prices from the last 52 weeks. The end numbers for both the 52wk Range and Day’s Range are 39.60, because this is the highest the stock got in that time. This shows us that the AT&T stock reached its 52-week peak earlier today. The 52wk Range in this case is 30.97 to 39.60, and highlights that AT&T has performed very well over the past year. It has increased its stock price by over 20 percent in the last 52 weeks, which is great news for AT&T investors.
Volume
This number refers to how much trading took place in the day in question. How many shares of AT&T were traded on this day? 25,894,974 according to the stock quote. If you are new to the stock market world, this number may show you just how much trading takes place every single day, especially with regards to the shares of major companies.
Avg. Vol (3m)
This number shows us the average volume of trading of the AT&T stock over the past three months. This means that someone took the volume of trading for every single day in the past three months, added them up, and took the average figure. The "Avg Vol (3m)" for AT&T is 28,364,800. This suggests that around 28 million shares are traded on average. The number for today, around 26 million, is slightly lower (around 7 percent) than the average. It is normal for today’s number to have a slightly higher or lower value. Unless the number is much larger or smaller than the average, it is not a very relevant comparison. If the difference in value is a lot, in terms of percentages, then it suggests that a major event took place, such as an earnings report or other related news.
Market Cap
Here is the total value of the company in question. For AT&T, we can see that the value is 242.67B, which is $242.67 billion. This number is there to show you how much you would have to pay in order to buy AT&T. If the company has a very high market cap, such as AT&T, it means that it is a very stable company in general. Companies that have lower market caps are a lot more volatile. However, this is not a hard and fast rule. Even very large companies can see massive fluctuations in stock price if something unexpected happens.
P/E (ttm)
In simple terms, the P/E ratio is a valuation ratio that shows us the company’s current share price in comparison to the per-share earnings. It is the market value per share divided by the earnings per share.
Let’s take a hypothetical company. Suppose the company is trading at $40 per share and the earnings from the last 12 months were $2 per share. In this case, the P/E ratio is 40/2 or 20. The current AT&T stock price shown in this example is 39.45, with the P/E ratio at 16.67. This means that AT&T currently has an earnings-per-share of $2.367. This is accurate because 39.45 / 2.367 equals 16.67.
EPS
Earnings per share is an important figure for any stock quote. It is the number we just calculated above. We can see that the number we calculated (2.367) is roughly equal to the 2.37 listed on the stock quote. Sometimes the P/E ratio and EPS numbers are rounded to two decimal points on the stock chart, but longer numbers are used to perform the specific calculations behind-the-scenes. It is typical of larger, stable companies to have a higher earnings-per-share, while new or more volatile companies will not have a significant earnings-per-share.
的calculation for EPS is as follows:
EPS = (Net Income - Dividends on Preferred Stock) / Average Outstanding Shares.
Div & Yield
This number refers to the dividend paid out by a company on their stocks. In this example, we see that AT&T pays out dividends of $1.92 per quarter, which is 4.94% of their earnings for that period. If you bought AT&T stock, you would earn roughly $1.92 x 4 or $7.68 per share in dividends.
Video on How to Read a Stock Table

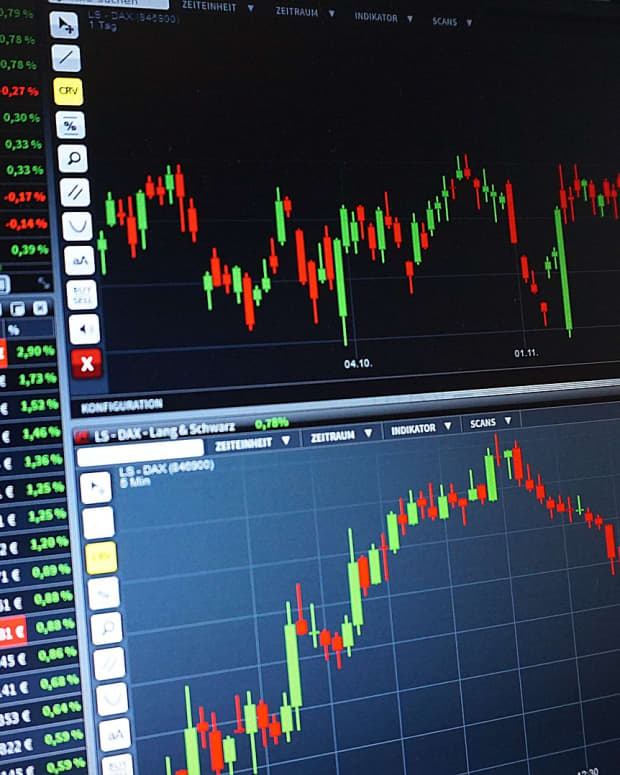
5 year price chart for AT&T stock.
How to Read a Stock Price Chart
上面的图表显示了运动the stock price for AT&T. The red and green bars at the bottom of the graph show the volume of trades.
Lookhereto see the stock price chart for AT&T on Yahoo Finance.
Video: How to Read a Stock Price Chart
Note
This article is to illustrate how to read a stock report summary. It is not an endorsement of AT&T stock. Consult your stock broker before buying and selling stock.
This article is accurate and true to the best of the author’s knowledge. Content is for informational or entertainment purposes only and does not substitute for personal counsel or professional advice in business, financial, legal, or technical matters.